IMPROVE THE OBSERVABILITY OF APPLICATIONS AND OVERALL ENVIRONMENT WITH NETSCALER

Information supplied by the Citrix Community Blog
In enterprise applications, observability involves evaluating the health, performance, and behavior of applications to promptly detect and address issues. Through the insights obtained from observability, it can enhance application performance and security, leading to an improved end-user experience.
The need for an integrated observability stack
Enterprises often create observability stacks using self-managed, cloud-hosted, or open-source solutions. These stacks enable actionable insights into applications, APIs, security posture, and various infrastructure components like networking, storage, compute, and security systems. NetScaler not only delivers high-performance application services but also includes built-in observability features.
This versatile integrated solution allows to view crucial application performance and security insights by integrating metrics into the preferred data visualization tool. NetScaler serves as a vital element in the observability stack, ensuring consistent performance and security across on-premises and public cloud environments for both traditional VM-based and modern Kubernetes applications.
Observability insights available in NetScaler
NetScaler offers detailed information in three essential areas to guarantee high-performing and secure applications: application and API insights, application security and API security insights, and network and infrastructure insights.
Application and API insights
NetScaler meticulously processes every HTTP, HTTPS, TCP, and UDP request to balance loads, optimize traffic, and direct it to backend applications. Additionally, NetScaler gathers crucial application and API data for actionable insights for application owners and networking teams:
- Latency
- Client network, application server, ISP, CDN, and NetScaler latency.
- Traffic
- User or API traffic volume handled by backend applications over time, along with details like source device, IP address, operating system, and location.
- Errors
- Comprehensive error information for major protocols like HTTP (4xx, 5xx response codes, invalid host headers, incomplete requests/responses), SSL (client hello rejections, server certificate revocations, etc.), and TCP (SYN retransmissions, checksum errors, TCP resets).
- Dependencies
- The interconnections between applications, databases, and east west microservices, as well as the health status of traffic among these interconnected services.
Application security and API security insights
In addition to providing comprehensive application and API security features such as web application firewall (WAF), IP reputation, TLS termination, AAA, and shadow API discovery. NetScaler also provides rich analytics for application and API security including:
- Vulnerability insights: Number and type of OWASP top 10 attacks such as buffer overflow, SQL injection, common vulnerabilities such as Log4J or Spring4Shell
- SSL certificates and traffic analytics: Applications rated SSL A+, SSL certificates expiring soon, strength of ciphers, SSL traffic handshake failures
- API analytics: API vs. user traffic, shadow APIs, API authentication success/failure rates, frequently accessed APIs
Network and infrastructure insights
In addition to offering a wide range of application and API security features like web application firewall (WAF), IP reputation, TLS termination, AAA, and shadow API discovery, NetScaler also presents detailed analytics for application and API security, which include:
- Vulnerability insights
- Identification and categorization of OWASP top 10 attacks such as buffer overflow, SQL injection, and common vulnerabilities like Log4J or Spring4Shell
- SSL certificates and traffic analytics:
- Evaluation of SSL A+ rated applications, upcoming SSL certificate expirations, cipher strength, and instances of SSL traffic handshake failures
- API analytics:
- Comparison between API and user traffic, shadow APIs, authentication success/failure rates for APIs, and frequently accessed APIs
The 4 observability pillars
Observability is built on four main pillars — metrics, events, logs, and traces, known collectively as MELT. NetScaler offers detailed insights for each of these data types:
- Metrics:
- NetScaler furnishes statistics and counters accessible via CLI or REST APIs (known as NITRO APIs in NetScaler). It also provides time-series metrics exportable to databases like Prometheus.
- Events:
- NetScaler notifies of specific events, like breaching CPU or memory thresholds or reaching system limits on an ADC.
- Logs:
- NetScaler boasts a comprehensive range of logs:
- Transaction logs:
- Generated for each request/response handled by NetScaler, these logs contain detailed HTTP, SSL, and TCP-level data, contributing to "Application and API insights" and "Application and API security insights."
- Syslogs:
- Generated in standard Syslog format, these logs provide information on how each request/response is processed by NetScaler components (e.g., LB, CS, SSL, and WAF).
- Other logs:
- Offer diverse information such as NetScaler ADC access, licensing details, and logs concerning the health of internal NetScaler processes.
- Transaction logs:
- NetScaler boasts a comprehensive range of logs:
- Traces:
- NetScaler creates distributed traces, particularly beneficial in microservices environments. These traces track requests from upstream (like front-end services) to downstream services (such as databases), pinpointing potential root causes within microservices.
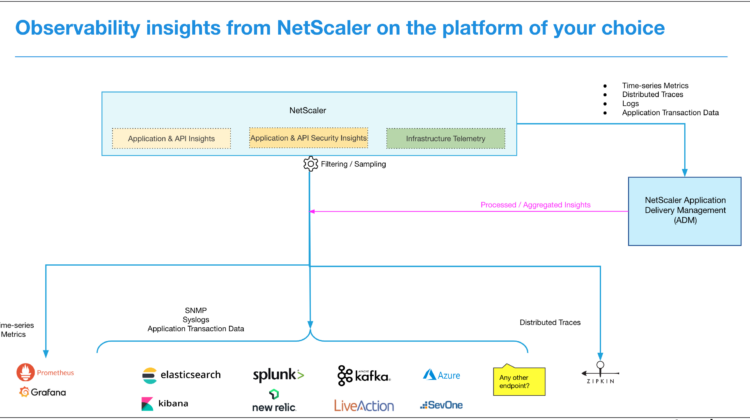
Flexibility to access NetScaler observability insights how to choose the correct path
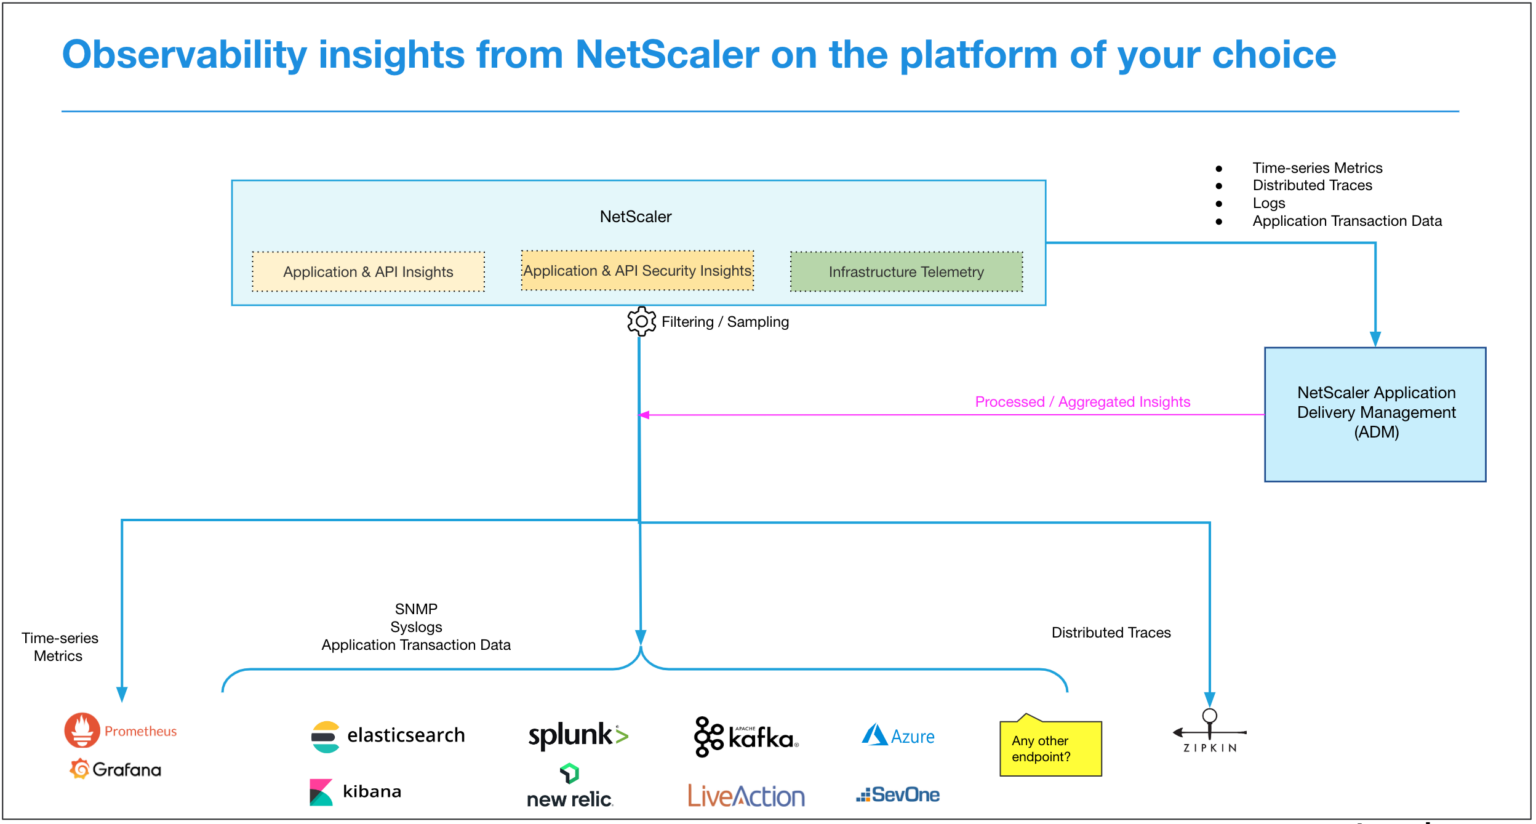
Understanding the types of insights provided by NetScaler, exploring how to access these insights easily. Below is a simplified way to access observability insights from the preferred platform or tool:
- Access through NetScaler ADC using command line or GUI for all hardware (MPX and SDX) and software (VPX, CPX, and BLX) form factors.
- Utilize NetScaler Application Delivery Management (ADM) service and ADM self-managed options.
- Integrate with the preferred application performance management (APM) and network performance management (NPM) tools like Prometheus, Grafana, Splunk, Elasticsearch, Kafka, SolarWinds, LogicMonitor, and more.
- Utilize a tailored automation solution via REST-based APIs (known as NITRO APIs in NetScaler).
Getting started with the NetScaler observability stack
The NetScaler Community site features articles, webinars, and more about the benefits of using the NetScaler observability stack. The community also offers more details in the documentation for NetScaler observability.